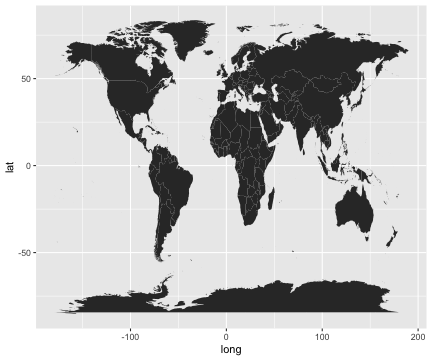
Code
using RCall

R"""
library(ggplot2)
library(maps)

# Import the data with coordinates
world <- map_data("world")

# Plot the map. group = group connects the points in the correct order
ggplot(data = world, aes(x = long, y = lat, group = group)) +
  geom_polygon()

# Equivalent to:
ggplot(world, aes(map_id = region)) +
  geom_map(data = world, map = world,
    aes(x = long, y = lat, map_id = region))
"""
┌ Warning: RCall.jl: Warning: package ‘maps’ was built under R version 4.2.3
└ @ RCall ~/.julia/packages/RCall/gOwEW/src/io.jl:172
┌ Warning: RCall.jl: Warning in geom_map(data = world, map = world, aes(x = long, y = lat, map_id = region)) :
│ Ignoring unknown aesthetics: x and y
└ @ RCall ~/.julia/packages/RCall/gOwEW/src/io.jl:172
RObject{VecSxp}